When 2 CPUs of “Nothing” Turned Into a Deep Mimir Lesson

Debugging Store-Gateway CPU Spikes, GC Thrashing, and a Hidden Memory Limit
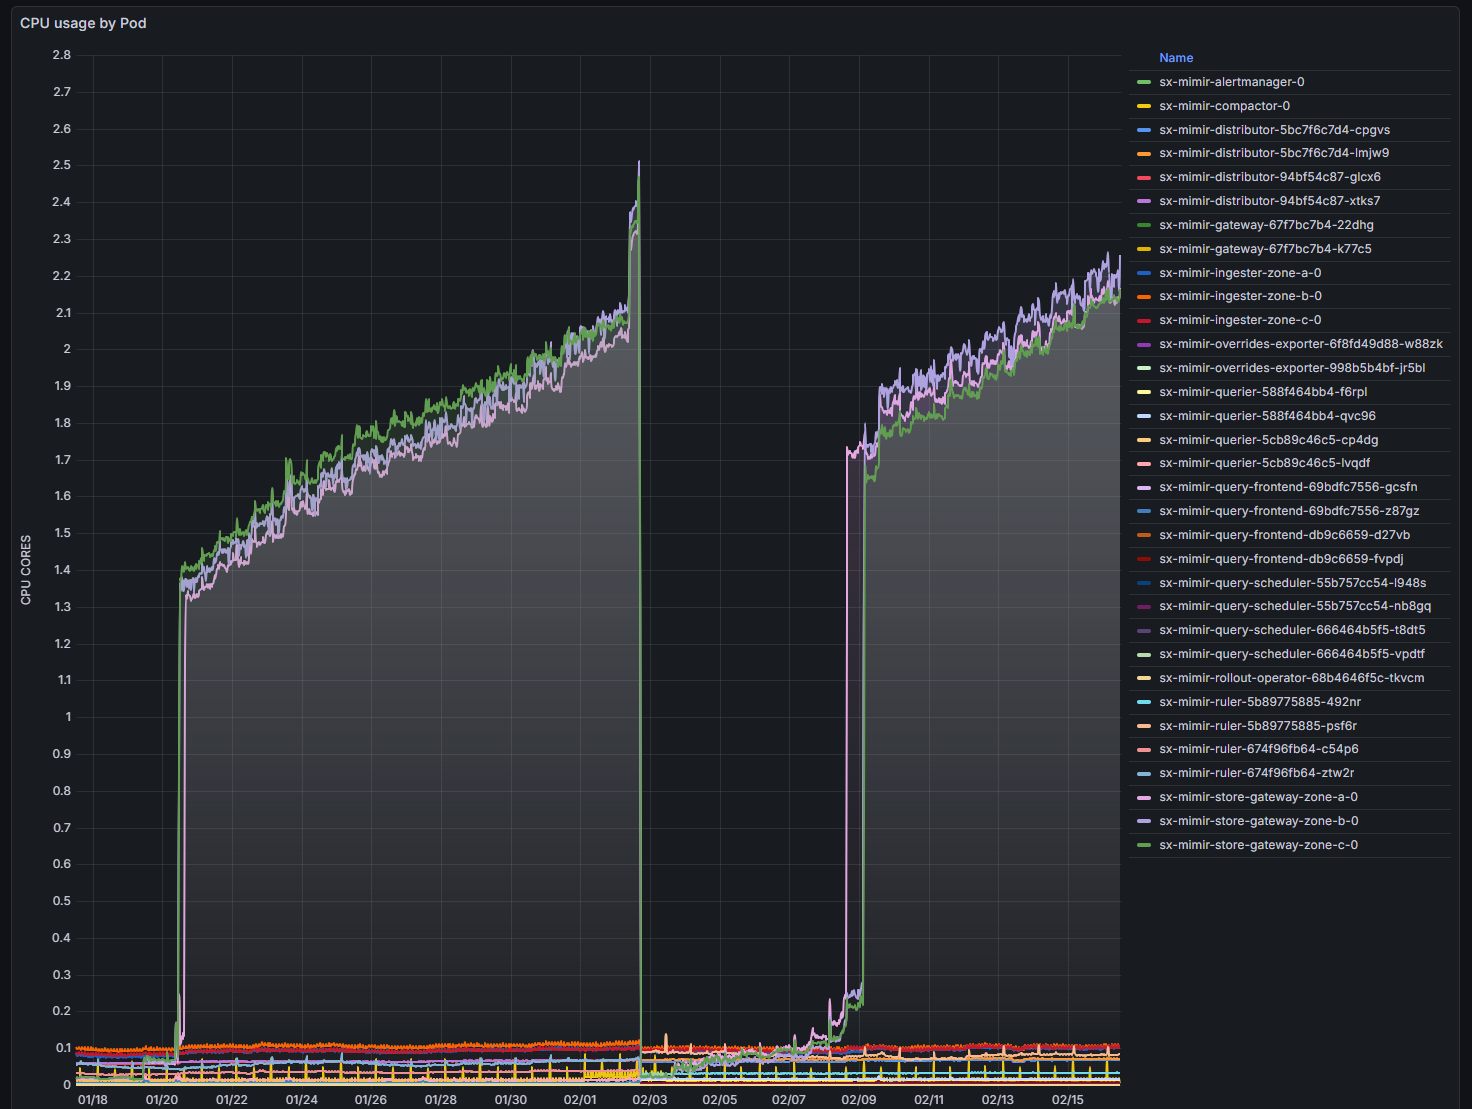
The symptom
Our Grafana Mimir store-gateway pods suddenly jumped from ~0.2 CPU to nearly 2 full cores each.
No traffic spike. No deployment. No restarts. No errors.
Just CPU.
This is exactly the kind of issue that sends engineers down rabbit holes — because nothing obvious is wrong.
Initial assumptions (all wrong)
When CPU spikes without traffic, the usual suspects are:
- query surge
- compactor backlog
- missing sparse index headers
- object storage latency
- throttling or node pressure
All plausible.
None correct.
The turning point: profiling instead of guessing
Instead of chasing hypotheses, we captured a CPU profile directly from a running store-gateway.
Mimir exposes Go’s built-in profiling endpoint, so you can sample real CPU usage without restarting anything.
We ran:
go tool pprof -top store-gateway.cpu.pprof
The result:
runtime.gcBgMarkWorker → ~95%
That means:
The CPU wasn’t busy doing useful work. It was almost entirely doing garbage collection.
At that moment the problem category changed completely.
This was not a load issue. This was a memory behavior issue.
Confirming with a heap profile
Next step: inspect memory.
Heap profile result:
- ~662 MB live heap
- ~83% used by index cache structures
This told us two important things:
- Memory usage was expected, not a leak.
- The cache was working normally.
So why was GC running constantly if memory usage was healthy?
The hidden culprit: GOMEMLIMIT
The answer wasn’t in Mimir code. It was in configuration.
The Helm chart automatically sets:
GOMEMLIMIT = memory_request
Our store-gateway configuration:
resources:
  requests:
    memory: 512Mi
So Go’s runtime believed:
“I must keep heap usage under 512 MiB.”
But the real working set needed ~660 MB.
That creates a classic GC thrash loop:
heap grows → exceeds limit → GC runs aggressively → CPU spikes → repeat
Nothing was broken. The runtime was behaving exactly as instructed.
Why Kubernetes made this subtle
We hadn’t set memory limits — only requests.
So Kubernetes would happily allow the container to use more than 512Mi.
But Go didn’t know that.
To Go, GOMEMLIMIT is the limit, regardless of Kubernetes policy.
This created a hidden mismatch:
| Layer | Believed limit |
|---|---|
| Go runtime | 512Mi |
| Kubernetes | unlimited |
This kind of cross-layer interaction is where many real production problems live.
The fix
Increase memory request.
We changed:
memory: 512Mi
to:
memory: 2Gi
That automatically raised:
GOMEMLIMIT ≈ 2Gi
Result:
- GC frequency dropped
- CPU dropped immediately
- system stabilized
No code changes. No scaling. No tuning.
Just correct sizing.
Why this happens specifically in store-gateway
Store-gateway is intentionally memory heavy.
It caches:
- index entries
- postings lists
- series metadata
These caches reduce latency and object-store reads.
So high memory usage is expected and desirable.
Trying to force it into a tiny memory footprint simply shifts cost to CPU (via GC).
How to capture a CPU profile from Mimir store-gateway
This is safe to do in production.
1) Port-forward to a pod
kubectl -n mimir port-forward pod/mimir-store-gateway 8080:8080
(your pod names may slightly be different)
2) Download a profile
curl -o cpu.pprof \
  http://localhost:8080/debug/pprof/profile?seconds=30
3) Analyze locally
go tool pprof -top cpu.pprof
Most useful commands inside pprof:
| Command | Purpose |
|---|---|
| top | hottest functions |
| top -cum | cumulative cost |
| list func | inspect code path |
Flame graph view:
go tool pprof -http=:0 cpu.pprof
How to capture heap profile
curl -o heap.pprof \
  http://localhost:8080/debug/pprof/heap
Analyze:
go tool pprof -top -inuse_space heap.pprof
Useful modes:
| Mode | Meaning |
|---|---|
| inuse_space | live memory |
| alloc_space | allocation churn |
| alloc_objects | allocation rate |
Reading profiles correctly
Common CPU profile signatures:
| Pattern | Interpretation |
|---|---|
| runtime.gc* dominates | GC thrashing |
| syscall dominates | IO bound |
| crypto/tls dominates | TLS overhead |
| app code dominates | real workload |
Profiles remove guesswork.
Key lessons
1. CPU problems are often memory problems
If GC dominates CPU, look at heap sizing first.
2. Requests matter more than limits for Go apps
When GOMEMLIMIT is tied to requests, the request effectively becomes the runtime memory ceiling.
3. High memory usage isn’t bad
Caches are supposed to use memory. Starving them just moves cost elsewhere.
4. Profiling > dashboards
Metrics tell you that something is wrong. Profiles tell you what is wrong.
5. Most production mysteries aren’t bugs
They’re interactions between layers:
- runtime behavior
- container scheduling
- Helm defaults
- caching logic
Understanding those interactions is what distinguishes platform engineers from operators.
Final takeaway
Nothing was broken.
The system behaved exactly as configured.
We just didn’t realize how those configurations interacted.
That’s the real lesson:
Production performance issues are often not failures — they’re misunderstandings.
And the fastest way to resolve them is:
Profile first. Tune second.