kubriX Status Dashboards
The kubriX status dashboards provide a quick health overview of kubriX services within a cluster and across all clusters.
They are intended to answer two questions:
- Is anything unhealthy right now?
- When did the status change?
- What is the root cause of the unhealthy service?
In addition to the dashboards, all related alerts can also be routed to your configured alert receivers.
Available dashboards
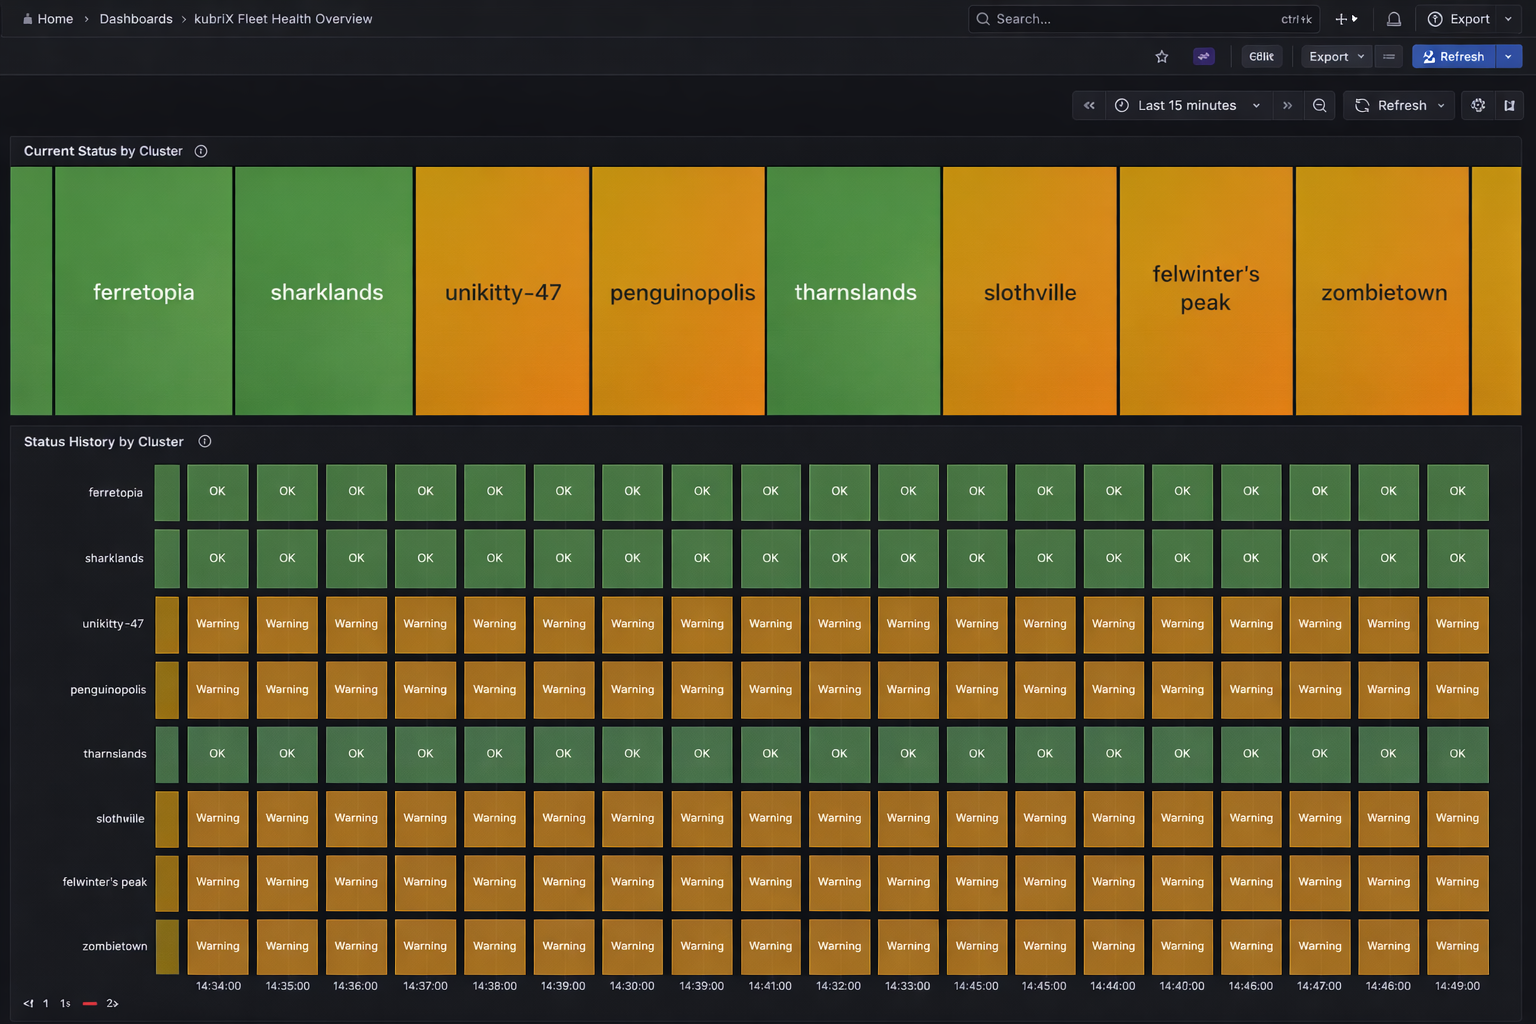
kubriX Fleet Health Overview
This dashboard shows the aggregated kubriX status for all clusters connected to this Hub.
It is useful for fleet-wide monitoring and quickly identifying clusters that require attention.
Panels:
-
Current Status by Cluster
Shows one status box per cluster. -
Status History by Cluster
Shows the historical aggregated cluster status over time.
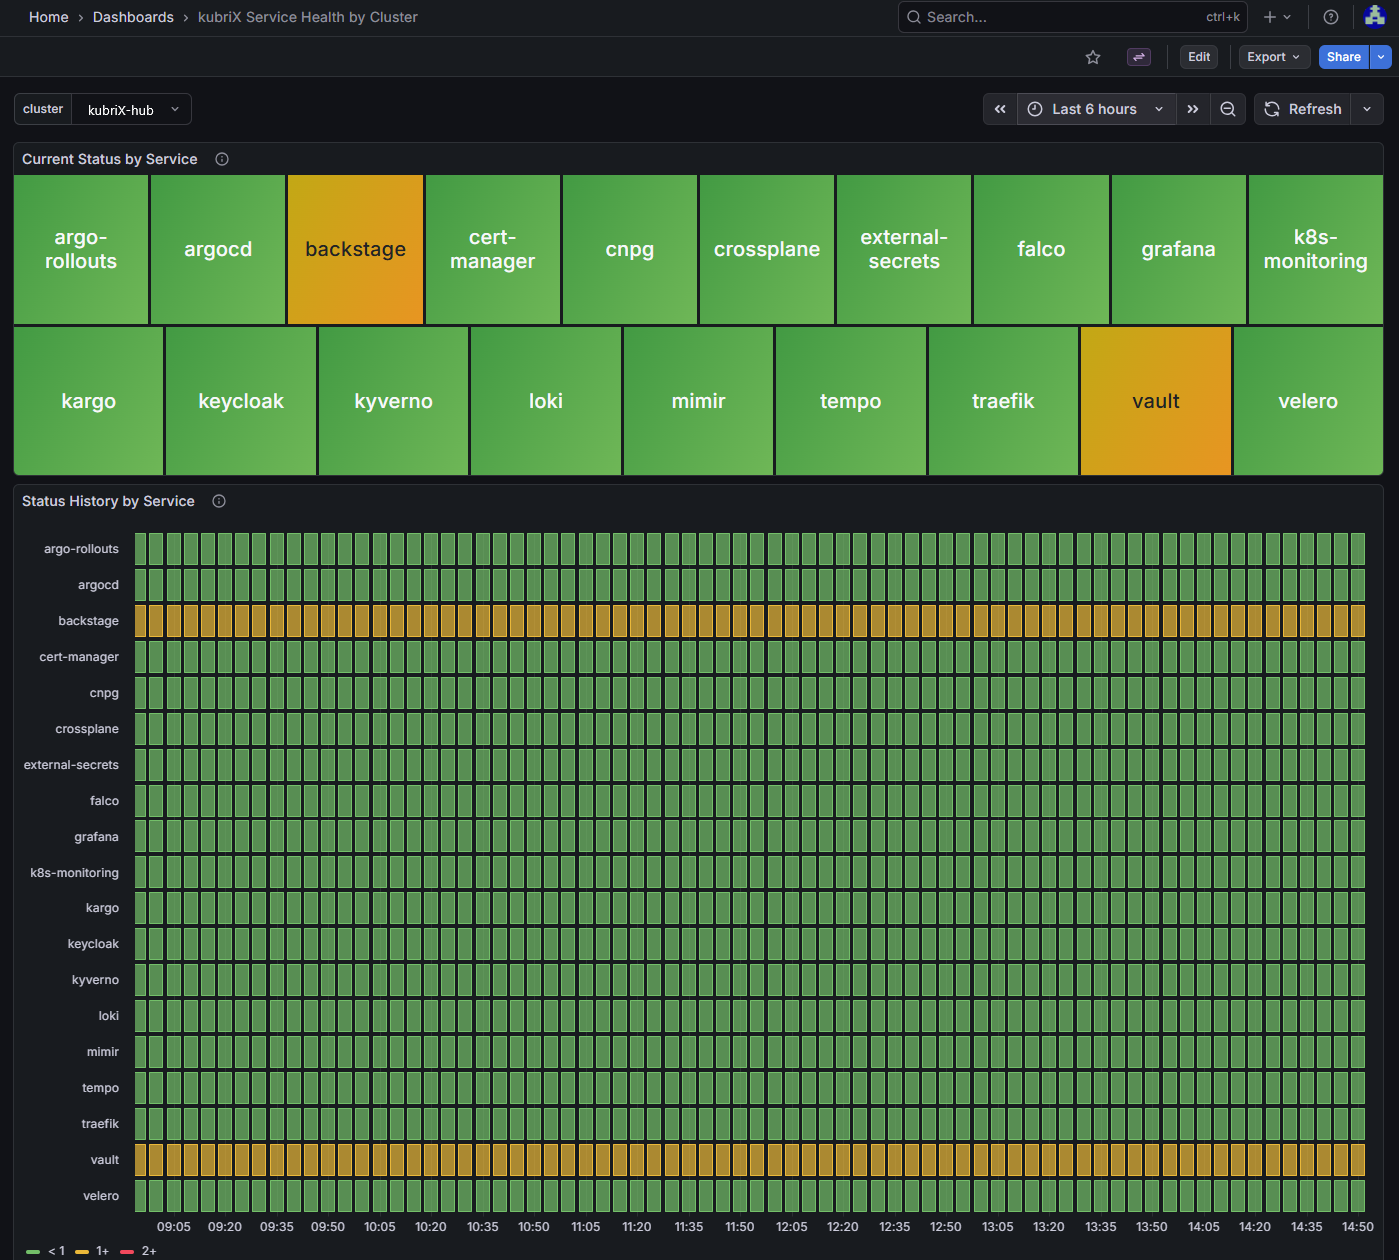
kubriX Service Health by Cluster
This dashboard shows the status of all kubriX services for one selected cluster.
It is useful when investigating the health of a specific cluster and identifying which service is causing degradation.
Panels:
-
Current Status by Service
Shows one status box per kubriX service in the selected cluster. -
Status History by Service
Shows the historical service status over time for the selected cluster.
Drill-down and investigation flow
The dashboards are designed to support investigation from a high-level fleet view down to service-specific alert details.
The dashboards are designed to support investigation from a high-level fleet view down to service-specific alert details.
- Start in kubriX Fleet Health Overview to identify clusters with a degraded overall status.
- Drill down into kubriX Service Health by Cluster for the affected cluster.
- From there:
- use the Current Status by Service panel to drill down to the active alerts of a specific service
- use the Status History by Service panel to drill down to the alert history of a specific service
This allows operators to move from a fleet-wide health overview to the concrete alerts that explain the current or historical service state.
Architecture
The kubriX status dashboards are based on alert-driven service health evaluation.
Any relevant problem in a kubriX service is expected to produce a Grafana-managed alert.
The recording rule kubrix_service_status then derives a service status from the active alerts in the corresponding namespace:
- no alert → green
- warning alert → yellow
- critical alert → red
The dashboards do not determine health on their own. They visualize the status that is produced by kubrix_service_status.
The overall flow is:
Service issue → Grafana alert → kubrix_service_status recording rule → kubriX status dashboards
Status model
The dashboards use a simple three-level status model:
-
0 = Green
No relevant alerts are active. -
1 = Yellow
At least one warning alert is active. -
2 = Red
At least one critical alert is active.
Critical always takes precedence over warning.
How service status is calculated
For each kubriX service, the recorded metric kubrix_service_status is calculated per cluster.
The status is derived from Grafana-managed alerts in the service namespace:
- if a critical alert is active, the service status is red
- otherwise, if a warning alert is active, the service status is yellow
- otherwise, the service status is green
A baseline metric is used so that healthy services still produce a 0 status per cluster.
How cluster status is calculated
Cluster status is derived from the service-level status metric:
max by (cluster) (
  kubrix_service_status{platform="kubrix"}
)
This means:
- if any service in a cluster is red, the cluster is red
- otherwise, if any service is yellow, the cluster is yellow
- otherwise, the cluster is green
History panels
The history panels show the worst observed status over a time window.
max_over_time(kubrix_service_status{platform="kubrix",cluster="$cluster"}[$__interval])
This helps smooth out short-lived fluctuations and makes status transitions easier to read.
Alert source
The dashboards are based on the GRAFANA_ALERTS metric and on the kubrix_service_status recording rules.
For correct per-cluster visualization, alert series must include the cluster label.
Typical usage
Use kubriX Fleet Health Overview for fleet overview and detection.
Use kubriX Service Health by Cluster for investigation of a specific cluster after an unhealthy state is detected.