Observability
In this document we give an overview how observability in our platform works, its main components and how to configure the observability stack.
High-Level Overview
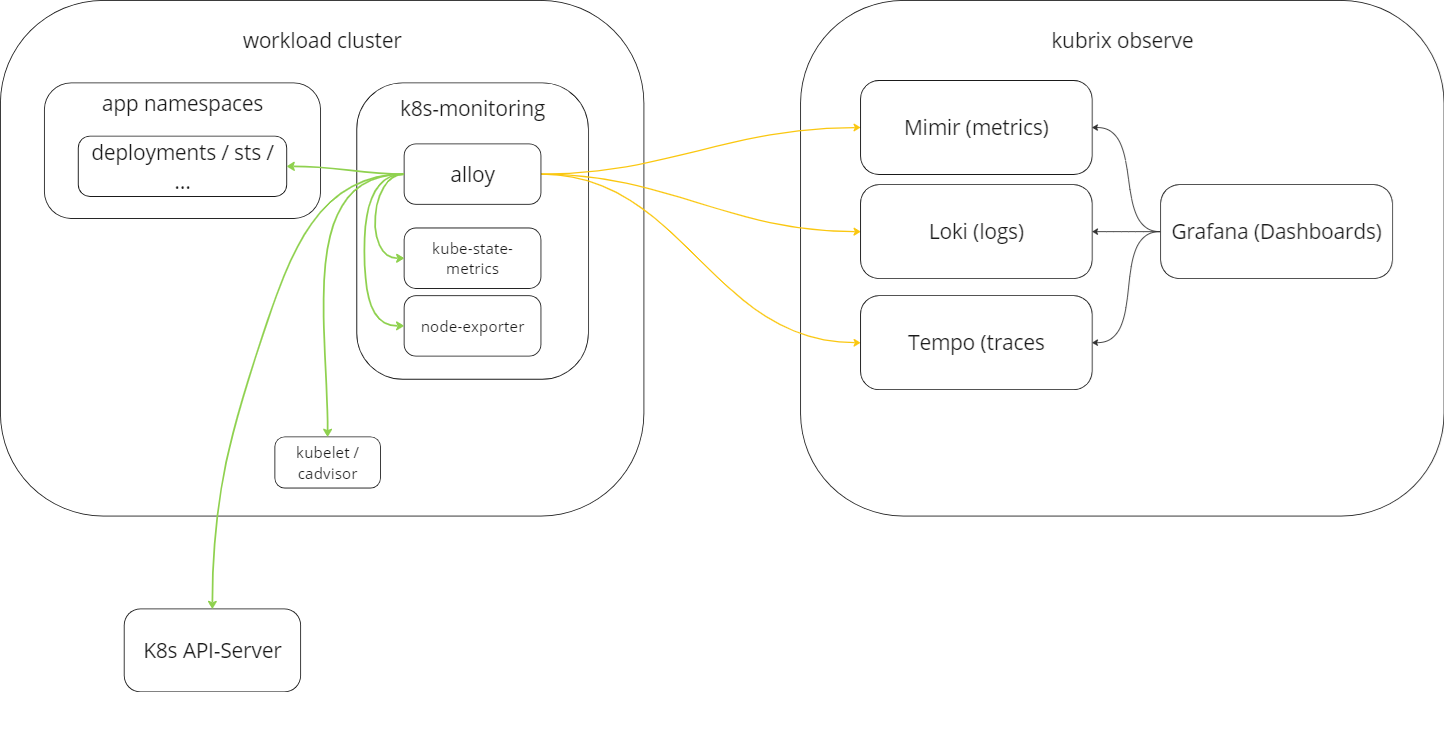
Via k8s-monitoring helm-chart Grafana Alloy and some additional prometheus exporter (kube-state-metrics, node-exporter) are installed on the workload cluster to scrape important metrics, gather logs from pods and receive otel traces from applications.
A more detailed structure of this chart is available in https://github.com/grafana/k8s-monitoring-helm/blob/main/charts/k8s-monitoring/docs/Structure .
Alloy pushes the metrics to Mimir, logs to Loki and traces to Tempo. Grafana displays those informations in the corresponding dashboards.
Platform Dashboard Folders
kubriX ships Grafana dashboards for its platform components. By default, these dashboards are placed in the kubriX folder. Provider-specific dashboard groups can use a separate default folder; for example, the Metalstack dashboards use metalstack.
Platform teams can change the destination folder in the corresponding chart's values-customer.yaml. Folder configuration is scoped per component or dashboard group; there is no single global folder setting. The examples below show the shipped kubriX default; replace it with the desired folder name to override it.
Most kubriX wrapper charts, including Argo CD, Backstage, CloudNativePG, Keycloak, KubeVirt, Kyverno, MinIO, OpenBao, Trivy, and Velero, use the top-level grafanaFolder value:
grafanaFolder: "kubriX"
The Grafana chart configures its dashboard groups individually:
kubernetesModernDashboards:
  grafanaFolder: "kubriX"

cardinalityDashboards:
  grafanaFolder: "kubriX"

# kubriX Prime only
kubrixStatusDashboard:
  grafanaFolder: "kubriX"
Some components expose dashboards through their upstream Helm chart and therefore use nested values. For example, Loki has both a kubriX-provided dashboard and upstream monitoring dashboards:
# kubriX-provided Kubernetes logs dashboard
grafanaFolder: "kubriX"

# Dashboards provided by the upstream Loki chart
loki:
  monitoring:
    dashboards:
      annotations:
        grafana_folder: "kubriX"
Mimir dashboards use the same Grafana folder annotation through their nested chart values:
mimir:
  metaMonitoring:
    dashboards:
      annotations:
        grafana_folder: "kubriX"
When customizing another component, start with its values-kubrix-default.yaml and override the dashboard folder value in values-customer.yaml. This preserves the kubriX-provided defaults while keeping customer configuration separate.
Customizing Metrics
k8s-monitoring helm charts get shipped with some default metrics
You can customize them in the metrics section of the values file and do also other customizations.
Application specific metrics can be scraped via Prometheus Operator CRDs or Annotations on your target pods, like described in Scraping Additional Metrics.